Investors ultimately want to have the best portfolio of assets that generates the highest expected returns and incurs the lowest associated risk. Using a maximum drawdown (MDD) ratio that measures the maximum drop in the investment value helps investors to assess the level of volatility risks associated with investment assets and map out a more effective portfolio allocation strategy.
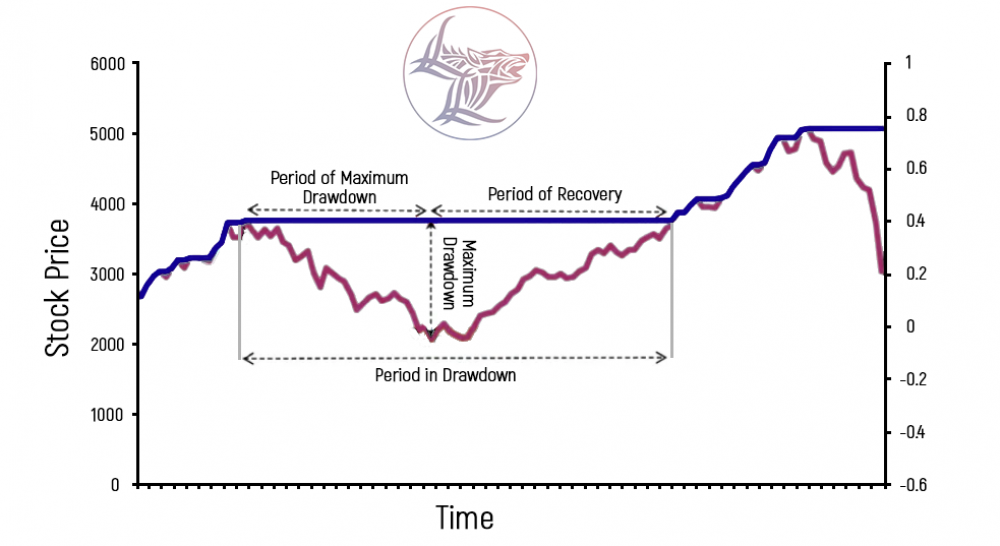
A maximum drawdown (MDD) shows the largest price decline derives from the difference between the rock-bottom value reached by the investment asset and that of its highest peak before hitting the trough. MDD is calculated over a long period when the value of an investment has undergone several trough to peak cycles.
Example of Maximum Drawdown
Here is an example that depicts the concept of a maximum drawdown. Let us assume the initial value of an investment portfolio is $600,000. Over a period, the portfolio value goes up to $850,000, before plunging to $300,000 in a ferocious bear market. It then rebounds to $700,000, before dropping again to $250,000. Subsequently, it more than triples to $900,000. What is the maximum drawdown?
250,000 – 850,00/ 850,000 x 100% = -70.59% will be the maximum drawdown in this case
It is important to remember that:
- The MDD calculation factors in the lowest portfolio value throughout the measured period ($250,000 in our example).
- The MDD calculation uses the initial highest peak of the measured period and leaves out a new higher peak and any other interim peaks within this period.
Tracking the historical volatility of an investment value, MDDs are also used in financial risk modeling to predict future price movements.
A low MDD value indicates slight fluctuations in the value of the investment and, therefore, a smaller degree of risk, and vice versa. When comparing two investment options, an investor who is risk-averse and wants to have a guarantee of stable returns is more likely to consider an investment option with a lower MDD value. On the other hand, an investor with a high appetite for risk in exchange for a higher return would be more inclined to select assets with higher MDD values.
Along with designating the drawdown, MDD also serves as a market performance indicator. The maximum drawdown for an asset can be checked against a stock market index in order to evaluate the asset's performance relative to the market. For example, If the MDD of an individual stock is less than that of its benchmark index, it means that the individual stock outperformed the index.
Thus, from August 2020 to this day, May 27, MMD of investment stocks managed with a market-neutral Long-Short, volatility-based strategy developed by our asset management company Sigma Global Management, equaled only 5,32%, as opposed to S&P 500 MDD of over 18%, outperforming the SPY MMD more than three times. This result testifies that market-neutral, volatility-based strategies work well to minimize investors’ risks in times of high volatility and uncertainty.
If you wish to find out more about this asset management strategy you are welcome to write us at: [email protected]