One of the prime goals sought by the professional fund managers working with well-defined mathematical models and trading strategies based on these models is enhancing the quality of risk modeling and lowering the probability of error/ dispersion of the regression model. This risk model follows the pattern of the trading strategy history into the future under the projected indicators, whereas the statistical homogeneity of a trading pattern is the core issue.
Why is the risks model corridor that displays multiple variations of closing transactions, positions, trading days, juxtapositions of such сlose-outs, and formations of VAR tail quantiles so important? Why is it so important from a risk managing perspective and risk model engineering perspective to lower the dispersion of the error generated by the trading system historical record?
For example, we would like to earn a certain amount of money during the next trading period, assigning a certain accuracy interval to it and cutting tails. The first thing that we apply in our future trading model is cutting the tails over the whole trading period, which is also called targeting. This is important because if we want to assign the utmost reliability to our model, the upside and the downside tails of the corridor must be cut as this will lower the dispersion of the volatility, making our model more accurate.
For example, we have certain statistical data from our previous trading sessions. We can build a VAR model with a 95% or 99% accuracy rate based on 250 days of our historic trading pattern and by considering the quantity of the VAR tag quintiles. This will show us how effective our model operates for the values within certain co-variation ranges. The main indicators we would need to look at when analyzing this are VAR’s accuracy, number of VAR tag quantiles, the average maximum value of VAR tag quantile for trading period, and the model confidence factor. Thus, if we have a 99% VAR accuracy, consequently the confidence factor of our model will be 99%
Consequently, we would transform fragmented indicators of, for example, trading days and their p/l index into a perceived separate asset with some elements of the analysis inherent to the classical investment asset. Some key parameters that must be included when building the risk model are:
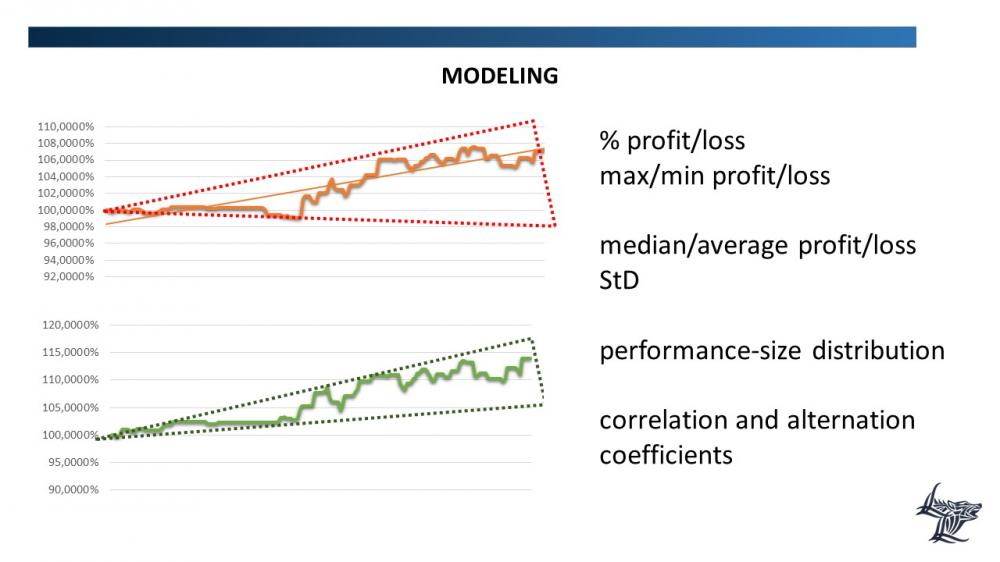
1) the profit to loss ratio - maximum profit to maximum loss, and minimum profit to minimum loss within and the dispersion within the period.
2) median/average profit to median/average loss; the standard deviation of profit to loss; performance-size distribution that implies distribution according to the magnitude of income-generating positions; for instance, the value of 99% of our transactions ranges from $1-$5, and only 1% accounts for $5-$10 transactions. This means we should discard this 1% (and use this 1% thereafter for analyzing the sources of excess profits/excess losses to cut the tails of our historical trading record).
3) correlation and alternation ratios (z-score and other).
The chart at the bottom of the attached image depicts the advantage of cutting the tails in application to risk modeling. This is a very approximated model; however, it provides a clear visual of the summary above. Thus, if we assume that the upper range boundary of the image designates the highest values of the risk model inclusive of all juxtapositions and covariances, and the lower range boundary designates the lowest values of the risk model, we conclude that the profitability of our trading system in the next trading period ranges from 5% to 15%.
On the other hand, if we do not cut the tails, and leave our trading system with the chance of forming prolonged, delayed series, then, as depicted on the chart at the top of the attached image, the lower range boundaries may cross the loss zone. This will indicate that not cutting tails quantiles will broaden the range of our risk model to the extent that during the next trading period our trading system may generate the values from -10% to +15%, which is not acceptable if we intend to achieve the goal set forth above – enhance the accuracy of financial risk modeling.
To make it short, we should apply this approach to all quantitative strategies that make up parts of our overall investment strategy. We will return to our discussion of long/short strategy, and this short account on ex-ante risk modeling is right on target as it includes a significant part of the long/short strategy.